Each of the movies below shows a flight along the same path through a tibia biopsy. Different techniques are used to visualize the trabecular structure of the bone.
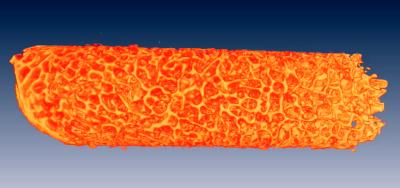
The first one uses volume rendering. This technique can be applied to the original data. The user has to choose a lower threshold below which the data is rendered transparent. An upper threshold selects which data are to rendered totally opaque. The data in the range between the two thresholds are displayed as kind of a foggy material.
The second movie uses an isosurface rendering. Only one threshold is used to extract a triangulated surface out of the original data. This surface is then rendered.
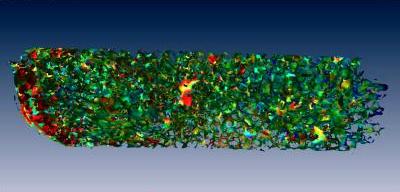
The third movie uses a skeleton surface to display the structure of the trabecular bone. The project page at ZIB describes this method in more detail. The idea is to represent the structure by a triangulated surface which is placed in the center of each trabecular. This gives a visually less dense image than an isosurface. Another benefit is that scalar values located at the center of a trabecular (e.g. the CT grey value) can be directly mapped onto the skeleton. In the movie a color coding is used to visualize the grey value of the original micro CT data.
|
Fly through a volume rendered image of a human bone biopsy (proximal tibia, diameter: 7 mm, length: 25 mm). [small version divx (1.1 MB)] [small version] [large version] |
|
|
Fly through an isosurface rendering of a human bone biopsy (proximal tibia, diameter: 7 mm, length: 25 mm). |

|
|
Fly through a surface rendering of a medial surface (skeleton) of a human bone biopsy (proximal tibia, diameter: 7 mm, length: 25 mm). The local mean grey value of the original micro CT image data are color-coded onto the surface (blue: low, red: high). [small version divx (1.7 MB)] [small version] [large version] |
|